Dotplots
Dotplots
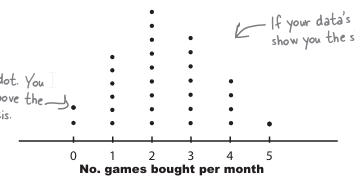
shows your data on a chart by representing each value as a dot. You put each dot in a stacked column above the corresponding value on the horizontal axis like this:
Sources: 1
shows your data on a chart by representing each value as a dot. You put each dot in a stacked column above the corresponding value on the horizontal axis like this:
Sources: 1